See how every part of your business is performing without leaving ISO Mate. Reporting and Analytics gives leaders, managers, and teams dedicated dashboards, precise filters, and one-click exports across every module in one place.
The challenge it solves
Answering a simple question like “how are we doing” usually means exporting data from several tools and stitching it together in spreadsheets by hand. The numbers are stale by the time anyone sees them, and it is hard to trust a report built from scattered sources. Reporting and Analytics keeps every metric live and in one place, so you can make decisions with current, reliable data.
What you can do
- Report across every module: dedicated dashboards for DevOps, QA, Tasks, Incidents, Compliance, Sales, Feedback, Calendar, and Help Desk.
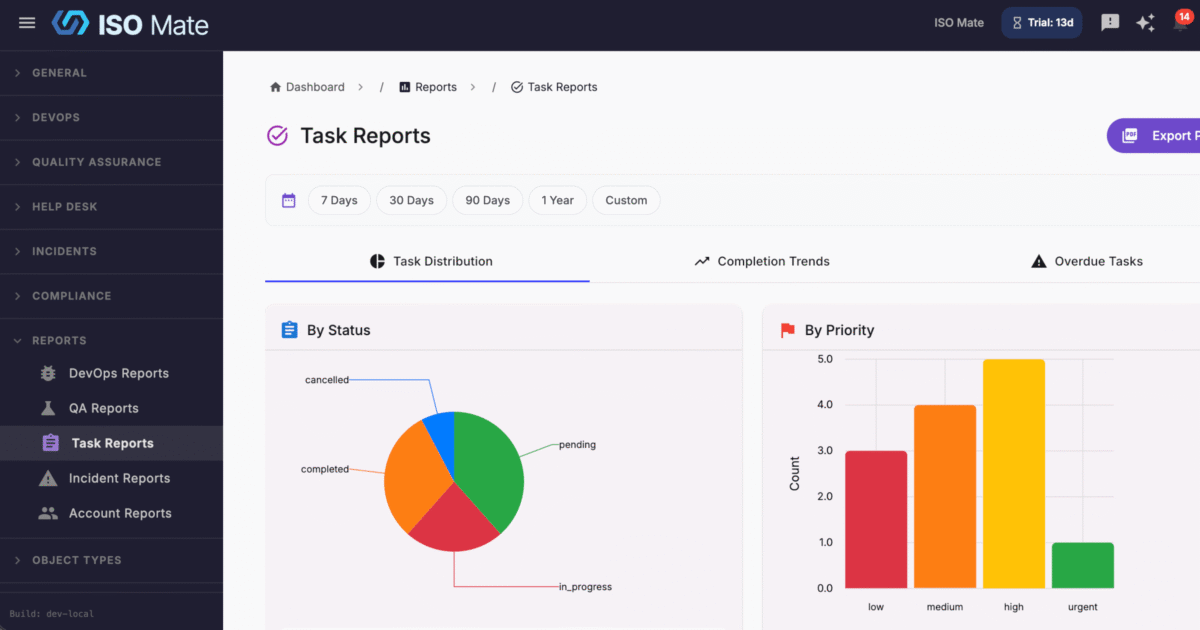
- Track the metrics that matter: status, type, and priority breakdowns, sprint burndown, test pass and fail rates, resolution times, and conversion trends.
- Design a dashboard for your role: a widget-based home with role-based templates, drag-to-reorder layout, and optional auto-refresh.
- Filter with precision: a token search bar with “is” and “is not” operators to focus on exactly the records you need.
- Switch time windows instantly: quick date range pills for 7 Days, 30 Days, 90 Days, and 1 Year.
- Export for any audience: send any report to PDF for stakeholder presentations or CSV for deeper analysis.
- Control who sees which data: a dedicated Reports permission group provides granular access to each report type.
Popular use cases
- Leadership reporting: give executives one view of delivery, quality, sales, and support health.
- Sales pipeline reviews: track deals by stage and pipeline value to spot bottlenecks before they cost revenue.
- Operations and workload planning: watch assignee workload and overdue items to balance capacity across the team.
- Sprint and delivery tracking: follow burndown, release progress, and issue aging so engineering stays on schedule.
- QA coverage and quality: monitor pass and fail rates and coverage trends to catch quality risks early.
- Support and SLA monitoring: review ticket volume, SLA compliance, and CSAT to keep customers happy.
Works with the rest of ISO Mate
Reporting and Analytics is the reporting layer over the whole platform. It draws live data from DevOps, QA, Tasks, Incidents, Compliance, Sales, Feedback, Calendar, and Help Desk, so every module you use feeds the same dashboards. Jump straight from a dashboard Quick Action to create issues, tasks, test cycles, incidents, tickets, and notes, and pull report data into AI assistants and external tools through the MCP server.
Key benefits at a glance
- One place for every metric: dashboards across all your modules in a single view.
- Answers in seconds: token search and quick date pills for fast, precise filtering.
- Ready to share: PDF and CSV exports for any audience.
- Access you control: granular Reports permissions per report type.